
Cover Crops vs. Nutrient Stratification: A 3-Year Soil Health Comparison
Share
Background
We compared two adjacent no-till sites that have been managed differently for the past 3 years:
- Area A (Managed): Vitalize Seed system with Carbon Load, NitroBoost, Vitalize Foliars, and Vitalize Natural Granulars (Vitalize Micros + No-Till Nurture).
- Area B (Untreated): Fescue sod with clover/weeds, no inputs in 2025, and only uncertain synthetic applications in 2023-2024.
Both soils tested had approximately 2% organic matter, a CEC of 15-18, and a pH of 7.5-7.8. That means the differences here are not from tillage, OM, or pH, but rather from management, biology, and nutrient cycling.
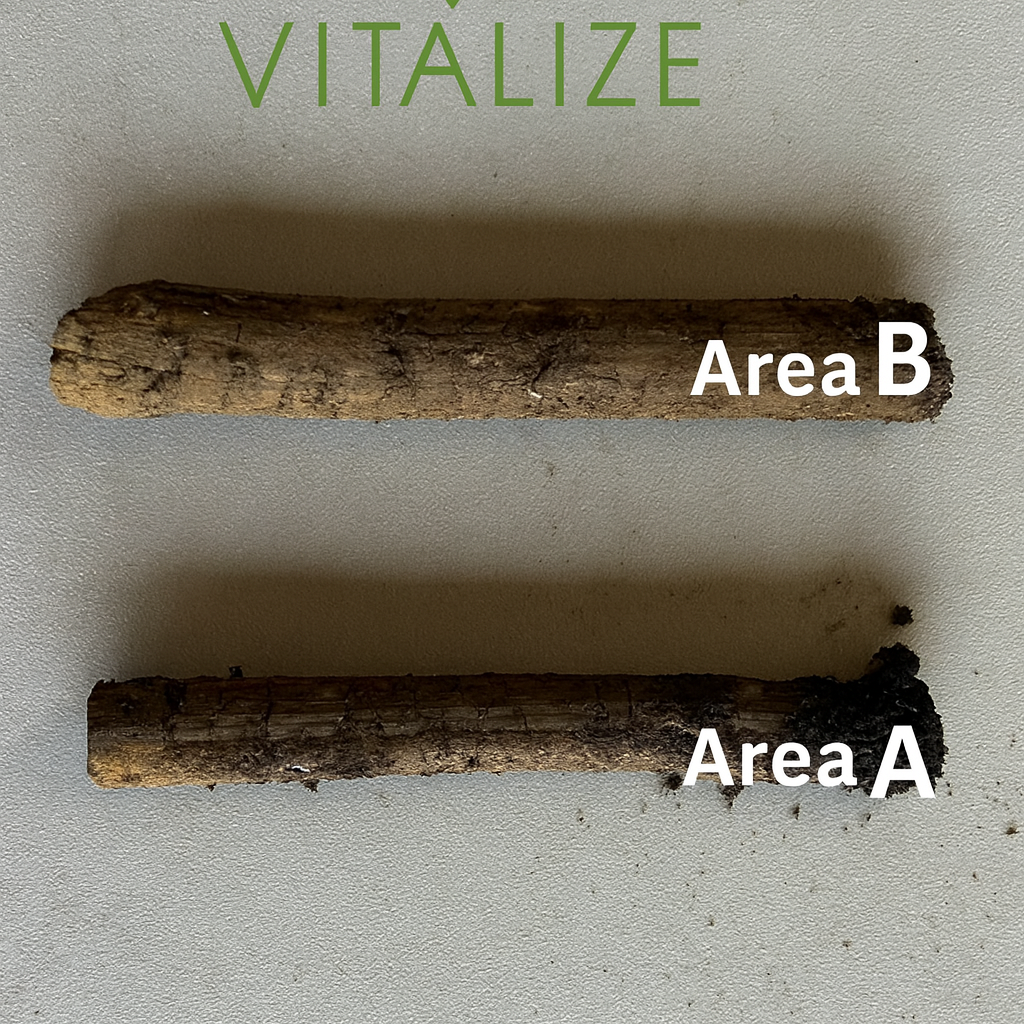
Visual Evidence: Soil Cores Tell the Story
- Area A (bottom core - Managed): Improved aggregation, darker organic coatings, and evidence of nutrient cycling into the lower portion of the core.
- Area B (top core - Untreated Sod): Tighter structure, lighter color, and stratification near the surface with limited signs of deeper nutrient movement.
These visual differences match the lab data. Area A is actively building a deeper, more balanced nutrient bank, whereas Area B remains stagnant at the surface.
Nutrient Comparison (Top / Mid / Bottom + % Difference)
| Nutrient | Area A (Top/Mid/Bottom) | Area B (Top/Mid/Bottom) | % Diff Top (A vs B) | % Diff Bottom (A vs B) |
|---|---|---|---|---|
| Phosphorus (lbs/ac) | 104 / 64 / 22 | 26 / 14 / 6 | 300% | 267% |
| Potassium (lbs/ac) | 204 / 150 / 110 | 190 / 100 / 94 | 7% | 17% |
| Sulfur (lbs/ac) | 202 / 115 / 104 | 62 / 68 / 67 | 226% | 55% |
| Nitrate (lbs/ac) | 5 / 1 / 1 | 0 / 0 / 0 | - | - |
| Zinc (ppm) | 26.27 / 42.15 / 11.44 | 4.04 / 1.56 / 1.16 | 550% | 886% |
| Copper (ppm) | 31.96 / 18.53 / 3.09 | 2.81 / 1.34 / 1.49 | 1037% | 107% |
| Manganese (ppm) | 7.1 / 3.6 / 2.9 | 4.7 / 4.5 / 3.1 | 51% | -6% |
| Iron (ppm) | 64.6 / 58.7 / 45.6 | 98.4 / 54.8 / 36.7 | -34% | 24% |
| Calcium (ppm) | 2268 / 2439 / 1691 | 2494 / 2780 / 2194 | -9% | -23% |
| Magnesium (ppm) | 308 / 245 / 163 | 267 / 197 / 257 | 15% | -37% |
| Sodium (ppm) | 57 / 57 / 32 | 35 / 27 / 29 | 63% | 10% |
Notes:
- A dash (-) indicates no measurable nutrient in Area B at that depth.
- Macros are expressed in pounds per acre; micros in parts per million.
- Both sites are no-till, with a CEC of 15-18 and an alkaline pH of 7.5-7.8.
What the Data Shows
-
Phosphorus and Sulfur
- Area A topsoil held 104 lbs/ac P vs. 26 in B (300% higher).
- Sulfur was over 3x higher in A at the surface and still higher at depth.
-
Potassium
- Both sites had similar topsoil K, but A carried it deeper into the profile.
-
Micronutrient Mobilization
- Zinc was 550% higher at the top and nearly 900% higher at the bottom in A.
- Copper was more than 1,000% higher at the top.
- These micros are critical for enzymes, nitrogen fixation, and stress tolerance.
-
Iron, Calcium, and Magnesium
- Iron was lower at the surface in A, consistent with more substantial plant uptake and cycling. Instead of being bound in the soil, Fe is actively utilized for chlorophyll and enzyme activity.
- Calcium and magnesium were intentionally lower in A, reflecting management aimed at gradually lowering the pH on alkaline soils. Through root exudation and cycling, we promote a better balance and long-term availability of P and micro-nutrients.
-
Stratification vs. Cycling
- In B, nutrients collapse with depth.
- In A, nutrients remain measurable at the mid and bottom layers, showing evidence of cycling rather than surface-only accumulation.
Why Fertilizer Placement Matters
This data also shows what happens if you throw synthetic fertilizer on the surface in a no-till monoculture system:
- Nitrogen is highly mobile and prone to loss without biology to capture it.
- Phosphorus tends to stay where it lands, remaining in the top half-inch and unavailable to roots deeper down.
- Potassium is also primarily regulated in the surface horizon of these soils.
The result is fertility stratified near the surface. Crops cannot fully access it, driving the need for additional inputs or tillage to incorporate it.
A note on tillage: Incorporating nutrients with tillage can reduce stratification in the short term. However, this often comes at the cost of reducing soil organic matter. With these soils already sitting at about 2% OM relative to a CEC of 15-18, further losses could be detrimental to structure, biology, and long-term fertility. The tradeoff is clear: less stratification, but weaker biological and carbon foundations.
This is not a criticism of monoculture farming (we need farmers), but it highlights why fertility type, placement, and timing are crucial. Managing fertility biologically reduces waste and improves both cost efficiency and ecological outcomes.
Looking Ahead: Biology as the Engine
The differences we see today are only the early stages of what a managed, balanced fertility system can accomplish. As Area A continues under intensive management with Vitalize Foliars and Vitalize Natural Granulars (Vitalize Micros + No-Till Nurture):
- Biological networks will deepen, extending rooting depth and nutrient exchange beyond the top 6 inches.
- Geological reserves will be tapped as biology unlocks nutrients bound in clays, silts, and sands.
- Soil porosity will improve as roots and microbes build aggregation.
- Deeper rooting will drive nutrient cycling further down, gradually reducing stratification.
This means the nutrient bank in Area A is not just bigger today. It is also growing stronger and deeper with each season of management.
Important Note
These results are based on conventional Mehlich-3 and DTPA extractions, which reflect plant-available nutrients. Because Area A has greater biological mass and microbial activity, a Total Nutrient Digestion (TND) test would likely show even larger nutrient reserves that biology can unlock over time.
Takeaway: Both areas were no-till, both had the same OM%, pH, and similar CEC. Yet, the managed system (A), utilizing Vitalize Foliars and Vitalize Natural Granulars (Vitalize Micros + No-Till Nurture), developed a nutrient-rich soil bank through biological processes and balanced fertility. In contrast, the untreated sod (B) stagnated. Instead of chasing nutrients with tillage or more fertilizer, we can let the soil do the work—feeding itself, our crops, and the wildlife we manage.